
I reviewed the books and operations for a Florida residential builder running nine active projects last month. Revenue was tracking […]
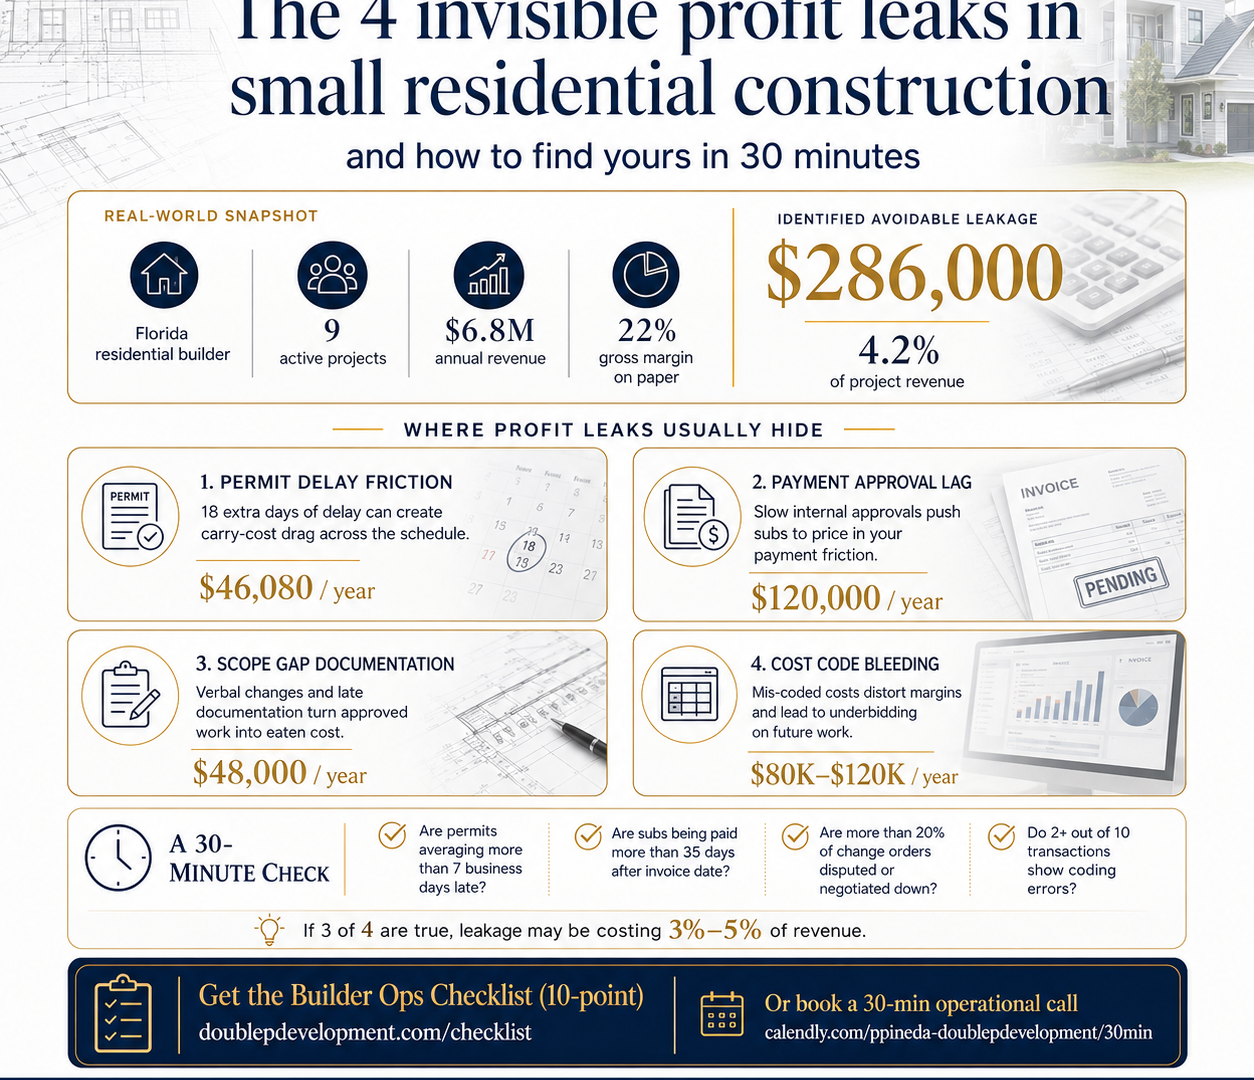
I reviewed the books and operations for a Florida residential builder running nine active projects last month. Revenue was tracking at $6.8M annually. Gross margin looked fine on paper at 22%. But when I mapped actual cash movement against job costs and timeline data, I found $286,000 in avoidable leakage over twelve months. That’s 4.2% of total project revenue disappearing into gaps that never show up on a P&L.
This article identifies the four most common profit leaks I see in residential construction operations between $2M and $15M in annual revenue. I’ll show you where they hide, how to calculate your exposure, and a 30-minute process you can run this week to find out if you have the same problem.
The problem most builders don’t see
Profit leaks are not the same as cost overruns. A cost overrun shows up as a line item. You see it. You argue with your PM about it. You adjust the next estimate. Profit leaks are different. They live in the gap between what you think is happening and what’s actually happening. They compound silently across multiple projects because the systems that should catch them either don’t exist or aren’t being used correctly.
The four leaks I’m describing are structural, not operational mistakes by individuals. They happen when a builder scales from three projects to eight projects without adding the right administrative layer. Your PM is capable. Your subs are solid. Your estimating is disciplined. But the connective tissue between field execution and back-office record-keeping starts to fray, and profit disappears in the gaps.
Most builders I talk to know something is wrong. They feel it when they finish a project that should have hit 24% margin but closed at 18%, and no one can explain exactly why. They see it when cash flow is tight even though AR looks current. The problem is not visibility into any single issue. The problem is that four separate leaks are happening simultaneously, and each one is small enough to ignore until you add them up.
What it actually costs
Leak one is permit delay friction. A permit sits with the AHJ for an extra eleven days because no one followed up at the right moment in the review cycle. Your framing crew is scheduled. You push them to another job. They come back three weeks later instead of next week because that’s when they have availability again. Now your electrician pushes. Your insulation contractor pushes. The compounding delay is eighteen days, and your carry cost on that project is $320 per day. That’s $5,760 per project. If you’re running eight projects a year, that’s $46,080 annually, and it never appears as a budget line item.
Leak two is payment approval lag. Your subcontractors submit invoices. Those invoices sit in someone’s email or in a shared folder for eight to fourteen days before they get approved and entered for payment. Your standard payment terms are net-30 from invoice date, but you’re actually paying at day 42 because of internal processing time. Subs notice. They don’t complain directly, but their next bid for you is 3% higher than it would be otherwise, because they’re pricing in your slow payment cycle. On a $4M annual subcontractor spend, that’s $120,000 in extra costs over the year.
Leak three is scope gap documentation. A homeowner asks for a change. Your PM agrees verbally on site. The work gets done. Three weeks later, you try to formalize the change order. The homeowner’s memory of the conversation is different from your PM’s notes, which are incomplete because the notes were never written down properly in the first place. You eat half the cost to preserve the relationship. This happens twice per project on average. The average eaten cost is $2,400 per occurrence. On ten projects, that’s $48,000.
Leak four is cost code bleeding in QuickBooks. Your chart of accounts was set up generically, not for construction. Costs that should be coded to specific jobs are getting coded to general categories, or they’re split incorrectly across multiple jobs because whoever is doing data entry doesn’t understand job costing. When you close out a project, your reported job cost is 5% lower than actual, which means you’re overestimating your margins and underpricing your next bid. This doesn’t feel like a leak because it shows up as lower-than-expected performance later, not as a visible loss now. But if it’s causing you to underbid by even 2% on new work, that’s $80,000 to $120,000 per year in margin you’re leaving on the table.
Where the breakdown happens
The breakdown is almost always at the handoff points. Permitting follow-up breaks down between the PM and the outside permit expeditor or the internal admin person who’s supposed to be checking the AHJ portal twice a week. No one owns it clearly, so it doesn’t get done consistently. Payment approval breaks down between the PM who needs to verify the work and the bookkeeper who needs to process the invoice. The PM is in the field. The bookkeeper sends an email. The PM responds four days later. Another five days pass before it’s entered.
Scope gap documentation breaks down in the field, the moment the conversation happens. If the PM doesn’t log it in the project management system within 24 hours, it’s already too late. Memory degrades. Details blur. The homeowner’s expectation and your record of what was agreed diverge, and now you have a dispute instead of a clean change order. Cost code bleeding breaks down during data entry. The person entering bills into QuickBooks is often part-time or doing it as one task among many. They don’t have construction accounting training, and they’re not cross-checking cost codes against the project budget structure. The PM doesn’t review it because they assume accounting is handling it.
These breakdowns happen because the operational systems that worked when you were running three projects don’t scale to eight or twelve projects. At three projects, the builder often handles permitting follow-up personally. At eight projects, that task gets delegated, but it’s delegated informally, without a checklist or a tracking system. At three projects, the builder reviews every invoice personally before it goes out for payment. At eight projects, that’s not possible, so it gets delegated to a PM, but the PM doesn’t have a clear SOP for what approval actually means.
What good looks like
Good operations in this revenue range have three characteristics. First, every handoff is owned by a named person with a defined frequency. Permitting follow-up is not “someone should check on permits.” It’s “Sarah checks the Duval County portal every Monday and Thursday before 10 AM and logs the status in JobTread.” Second, status is visible without asking. The builder should be able to open a single dashboard or shared sheet and see permit status, outstanding AP approvals, and open change orders without sending a single Slack message or text.
Third, the system is designed for part-time or offshore execution. This is not about hiring a $75K operations manager. It’s about designing the checklist, the tracking sheet, and the approval workflow so clearly that someone working four hours a day can execute it correctly. I have seen this work with a part-time project coordinator in Atlanta and with an offshore admin team in the Philippines. The difference is not the labor cost. The difference is whether the process is documented and whether status is tracked.
A builder in North Carolina running eleven active projects implemented a weekly permit tracking sheet and assigned it to an offshore project coordinator working 20 hours per week. The coordinator’s only job was to check permit status with each AHJ, update the tracker, and flag anything delayed more than five business days past the expected review timeline. Permit-related project delays dropped by 60% in the first quarter. The cost was $1,400 per month. The avoided carry cost on delays was approximately $8,000 per month.
How to identify if this is happening to you
You can surface your exposure to these four leaks in about 30 minutes using data you already have. For permit delay friction, pull your last eight projects and compare the planned permit approval date in your original schedule to the actual approval date. If the average delay is more than seven business days, you have this leak. For payment approval lag, pull your AP aging report and calculate the average days between invoice date and payment date for subcontractors. If it’s over 35 days and your terms are net-30, you have this leak.
For scope gap documentation, look at your last ten change orders. How many of them were disputed or negotiated down from your original ask? If more than 20% involved any pushback from the homeowner about scope or price, you likely have incomplete documentation at the point of sale. For cost code bleeding, pick two closed projects and compare the final job cost report in QuickBooks to the budget. Then spot-check ten transactions. Are they coded to the correct cost codes? Are job costs split correctly when a single bill covers multiple jobs? If you find more than two errors in ten transactions, your chart of accounts or your data entry process has a problem.
This is not a full audit. It’s a directional check. But if you score positive on three out of four of these, you’re likely losing between 3% and 5% of revenue annually to these leaks. On a $5M operation, that’s $150K to $250K. On a $10M operation, it’s $300K to $500K.
What works instead
Fixing these leaks does not require new software or an additional full-time hire. It requires three things: assignment, frequency, and visibility. Assignment means every task has a name attached. Not a role, a name. “The PM” is not an assignment. “Jake” is an assignment. Frequency means every task has a defined schedule. “Check permits regularly” is not a frequency. “Every Monday and Thursday at 9 AM” is a frequency.
Visibility means status is accessible in a single place without asking. I use shared trackers in Google Sheets for most of this. One sheet for permit status across all active projects. One sheet for AP approvals pending. One sheet for change orders in progress. The tracker is updated by the person assigned, and the builder reviews it once a week. If something is overdue, it’s highlighted automatically using conditional formatting.
The typical implementation with a Double P client starts with mapping the four leaks, quantifying the cost, and then building the tracking sheets and assignment structure. This takes between two and four weeks depending on how many active projects are running and how clean the existing data is. The ongoing maintenance is handled by offshore project coordinators and bookkeepers who update the trackers daily and flag exceptions. The builder’s involvement drops to a 20-minute weekly review.
The math
If you’re running $5M in annual revenue and you have three of the four leaks, your exposure is roughly $180K per year. Fixing it requires approximately $1,500 to $2,200 per month in operational support, depending on which package fits your project volume. That’s $18K to $26K annually. The ROI is between 6:1 and 10:1 in year one, and the systems you build become the foundation for scaling to $8M or $12M without adding chaos.
The alternative is to keep running the same way and accept the leakage as the cost of doing business. Some builders do this intentionally. They know the leaks exist, and they decide that fixing them is not worth the effort. That’s a valid choice if you’re planning to stay at your current revenue level and your margins are strong enough to absorb it. But if you’re trying to grow, the leaks compound. At $8M in revenue with the same four leaks, you’re losing $320K per year. At $12M, it’s $480K.
The faster you grow without fixing the leaks, the worse the problem gets. I have seen builders scale from $4M to $10M in 24 months and watch their net margin compress from 12% to 7% because operational leakage grew faster than revenue. They added project volume but not operational structure, and the profit disappeared into the gaps.
What this means for your operation
If you recognized two or more of these leaks in your own projects, you should run the 30-minute diagnostic this week. Pull the data, calculate the numbers, and see what your actual exposure is. The Builder Ops Checklist I reference below includes the exact questions to ask and the formulas to calculate cost for each leak. Most builders who complete it find at least one leak they weren’t aware of.
The next step is not to overhaul your entire operation. The next step is to fix one leak and measure the result. Pick the one costing you the most, assign it clearly, set the frequency, and build visibility into a tracker. Run it for 30 days and compare the result to your baseline. If it works, add the second leak. If it doesn’t, adjust the process and try again.
If you want the Builder Ops Checklist (10-point) referenced above, here’s the direct link: doublepdevelopment.com/checklist
If something here resonates with your operation, the next step is a 30-min call. No pitch, just an operational conversation. calendly.com/ppineda-doublepdevelopment/30min
Streamline your permitting process now.
Our expert team handles every submission, follow-up, and compliance hurdle so you can focus on building.